|
|
 |
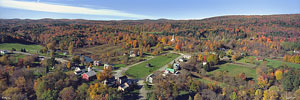
Westford: July 28, 2026
LOCAL CLIMATOLOGICAL DATA
Hourly Summary
July 28, 2026

Station: Westford
Latitude: 44° 37' 38" N
Longitude: 73° 02' 30" W
Elevation (ground): 850 ft.
Time Zone: Eastern

+--+------------------------+----+-----+--------------------+------------------------+------+
|  |       Temperature      |    | Pre-|      Pressure      |           Wind         |Solar |
|  +------+------+------+---+ Hu-|cipi-|  Adj. to Sea Level +----+---+-------+-------+------+
|  |   M  |   M  |      |   |mid-| ta- +------+------+------+ Avg|Res| Peak  |2Minute| Mean |
|  |   a  |   i  |      | D | ity| tion|      |      |      |    |   +---+---+---+---+   W  |
|  |   x  |   n  |      | e |    |     |      |      |      |  S |   | S |   | S |   |   a  |
| H|   i  |   i  |   M  | w |  M |     |      |      |   M  |  p |   | p |   | p |   |   t  |
| o|   m  |   m  |   e  |   |  e |Water|   M  |   M  |   e  |  e | D | e | D | e | D |   t  |
| u|   u  |   u  |   a  | P |  a |     |   a  |   i  |   a  |  e | i | e | i | e | i |   s  |
| r|   m  |   m  |   n  | t |  n |Equiv|   x  |   n  |   n  |  d | r | d | r | d | r |  m²  |
|  |      |      |      |   |    |     |      |      |      |    |   |   |   |   |   |      |
| 1|   2  |   3  |   4  | 5 |  6 |  7  |   8  |   9  |  10  | 11 | 12| 13| 14| 15| 16|  17  |
+--+------+------+------+---+----+-----+------+------+------+----+---+---+---+---+---+------+
|00| 65.4 | 63.4 | 64.5 | 62|  91| 0.01| 29.68| 29.66|29.673| 0.0|120|  0| SE|  0|153|    0 |
|01| 63.4 | 62.6 | 62.9 | 60|  92| 0.00| 29.66| 29.65|29.656| 0.0|120|  0| SE|  0|153|    0 |
|02| 62.9 | 61.9 | 62.4 | 60|  93| 0.00| 29.65| 29.64|29.640| 0.0|120|  0| SE|  0|153|    0 |
|03| 62.0 | 61.3*| 61.8 | 60|  94| 0.00| 29.64| 29.63|29.635| 0.0|120|  0| SE|  0|153|    0 |
|  |      |      |      |   |    |     |      |      |      |    |   |   |   |   |   |      |
|04| 62.8 | 61.3 | 62.0 | 61|  95| 0.00| 29.64| 29.63|29.634| 0.0|162|  4|  S|  1|164|    0 |
|05| 63.0 | 62.6 | 62.8 | 61|  95| 0.00| 29.63| 29.62|29.627| 0.1|160|  5|SSE|  1|159|    3 |
|06| 65.0 | 62.9 | 63.8 | 62|  95| 0.00| 29.64| 29.63|29.630| 0.1|178|  5|  S|  1|193|   45 |
|07| 68.3 | 65.0 | 66.9 | 66|  96| 0.00| 29.63| 29.62|29.621| 0.2|188|  5|  S|  1|191|  132 |
|  |      |      |      |   |    |     |      |      |      |    |   |   |   |   |   |      |
|08| 72.5 | 68.3 | 70.3 | 68|  93| 0.00| 29.63| 29.61|29.619| 0.4|190|  8|  S|  2|234|  287 |
|09| 75.5 | 72.5 | 73.8 | 69|  85| 0.00| 29.61| 29.60|29.608| 0.2|155|  4|  E|  1|180|  268 |
|10| 78.9 | 75.4 | 77.3 | 71|  80| 0.00| 29.61| 29.60|29.607| 1.3|202| 10|ESE|  4|228|  532 |
|11| 79.0 | 77.5 | 78.0 | 71|  78| 0.00| 29.61| 29.60|29.609| 0.7|200| 11|SSE|  3|179|  359 |
|  |      |      |      |   |    |     |      |      |      |    |   |   |   |   |   |      |
|12| 80.7 | 79.0 | 79.9 | 71|  75| 0.00| 29.61| 29.59|29.598| 1.3|195| 10|  S|  4|174|  453 |
|13| 80.5 | 79.4 | 79.9 | 71|  75| 0.00| 29.59| 29.58|29.585| 0.4|147|  9|SSE|  3|172|  406 |
|14| 80.8*| 73.4 | 78.6 | 71|  78| 0.40| 29.60| 29.57|29.581| 0.3|180|  7|  S|  3|215|  150 |
|15| 73.4 | 72.3 | 72.7 | 69|  88| 0.01| 29.59| 29.56|29.575| 0.0|158|  2|SSE|  0|158|  208 |
|  |      |      |      |   |    |     |      |      |      |    |   |   |   |   |   |      |
|16| 72.6 | 68.6 | 69.9 | 67|  89| 0.76| 29.59| 29.56|29.577| 0.4|193| 10|SSE|  5|184|   50 |
|17| 69.8 | 69.0 | 69.2 | 67|  92| 0.00| 29.58| 29.57|29.572| 0.0|250|  1|WSW|  0|250|  107 |
|18| 70.2 | 69.7 | 70.0 | 68|  94| 0.44| 29.58| 29.57|29.571| 0.3|190| 16|  S|  6|193|   39 |
|19| 69.7 | 66.1 | 67.5 | 65|  93| 0.11| 29.59| 29.58|29.584| 1.4|185| 12|ESE|  5|162|   16 |
|  |      |      |      |   |    |     |      |      |      |    |   |   |   |   |   |      |
|20| 66.3 | 65.8 | 66.0 | 64|  94| 0.00| 29.59| 29.58|29.587| 0.3|179| 11|  S|  2|163|    0 |
|21| 66.0 | 65.7 | 65.8 | 64|  94| 0.00| 29.59| 29.58|29.586| 0.0|150|  3| SE|  0|148|    0 |
|22| 65.7 | 65.1 | 65.4 | 64|  94| 0.00| 29.60| 29.58|29.589| 0.0|144|  0| SE|  0|148|    0 |
|23| 65.1 | 64.9 | 65.0 | 64|  95| 0.04| 29.60| 29.59|29.595| 0.0|144|  0| SE|  0|148|    0 |
+--+------+------+------+---+----+-----+------+------+------+----+---+---+---+---+---+------+
   | ---- | ---- | ---- | - | -- |Total|                For the day:                 | ---- |
   +------+------+------+---+----+-----+------+------+------+----+---+---+---+---+---+------+
   | ---- | ---- | ---- | - | -- | 1.77| 29.68| 29.56|29.607| 0.3|188| 16|  S|  6|193| ---- |
   +------+------+------+---+----+-----+------+------+------+----+---+---+---+---+---+------+
   |     Avg     | Mean |Avg| Avg|Month| Hour | Hour | ---- | -- | - |  Hour |  Hour |  Avg |
   +-------------+------+---+----+-----+------+------+------+----+---+-------+-------+------+
   |     71.1    | 69.0 | 66|89.5| 3.50|   0  |  15+ | ---- | -- | - |   18  |   18  | 127.3|
   +-------------+------+---+----+-----+------+------+------+----+---+----+--+---+---+------+
   | Total Snow,        |                                   |             |      |  Heat   0|
   | Ice Pellets        | Greatest Depth on Ground          | Precip Types|Degree+----------+
   |                0.0 | of Snow, Ice Pellets or Ice     0 |  .........  | Days |  Cool   6|
   +--------------------+-----------------------------------+-------------+------+----------+

  NOTES:
   Data in columns 4, 5, 6, 10, 11, 17 are means via continuous observations for each hour.
   Units: Temperature=°F, Wind=mph, Pressure=Inches Hg, Precipitation=inches.
   Column 5: Dew point is calculated from temperature and humidity and is continuously averaged for each hour.
   Column 12: Resultant wind is calculated by the vector sum of continuous wind observations.
   Precipitation types:
     1 FOG, 2 HEAVY FOG, 3 THUNDER, 4 ICE PELLETS, 5 HAIL, 6 GLAZE, 7 DUSTSTORM,
     8 SMOKE/HAZE, 9 BLOWING SNOW.
   Degree Days heating base is 65°F, cooling base is 65°F.
|
 |
Current Radar Loop:
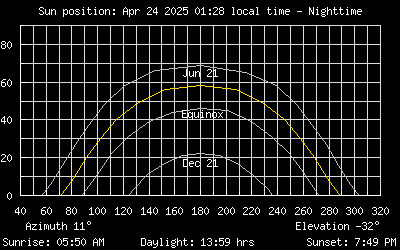
Sun Position
|
|